
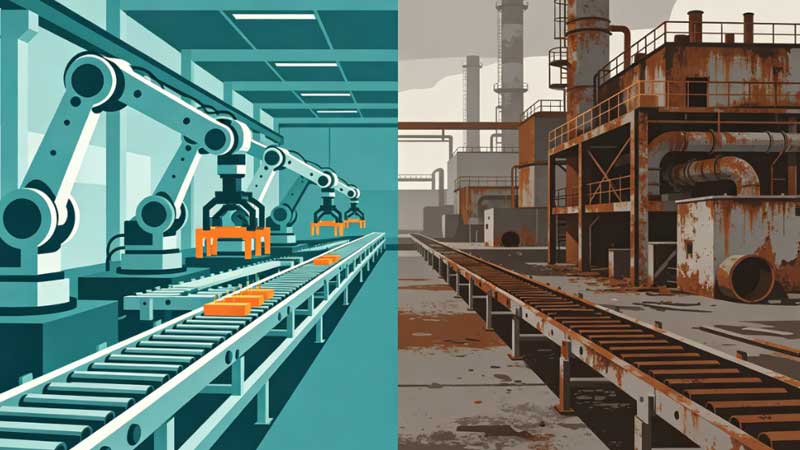
Manufacturing automation investment in China has reached record levels in 2025-2026, with industrial robot installations growing 22% year-over-year to over 350,000 units. However, a significant divide has emerged: factories with robotic automation are 40% more capacity-efficient than non-automated competitors, creating a widening productivity gap. While Tier 1 suppliers and export-oriented factories have embraced automation, many smaller and inland factories lag behind competitors, risking obsolescence. This report analyzes automation investment trends, the 40% capacity efficiency advantage of robotic automation, which factory segments are lagging, and how our capacity checks now include automation level assessment to help buyers identify high-performing suppliers.
1. Automation Investment Surges – Market Overview 2026
Automation investment in Chinese manufacturing has surged to unprecedented levels. Total spending on industrial robotics, automated production lines, and factory automation systems reached 320 billion RMB ($44 billion) in 2025, up from 210 billion RMB in 2022. However, as automation investment surges, some factories lag behind competitors, creating a two-speed manufacturing landscape.
Key automation investment statistics:
- Industrial robot installations (2025): 352,000 units – up 22% from 288,000 in 2024. China now accounts for 52% of global industrial robot installations.
- Automation investment by sector: Automotive (38% of total), electronics (28%), metalworking (12%), food/beverage (8%), logistics (7%), others (7%).
- Robot density (robots per 10,000 manufacturing workers): National average 470 – up from 320 in 2021. Leading regions: Guangdong (580), Jiangsu (540), Zhejiang (510), Shanghai (490). Lagging regions: Inland provinces (150-250).
- Return on automation investment: Average payback period for industrial robots now 18-24 months (down from 36-48 months in 2018).
- Automation adoption rate by factory size: Large factories (500+ workers): 78% have significant automation. Medium (100-500): 45%. Small (under 100): 22%.
The automation investment surge is driven by rising labor costs (manufacturing wages up 8% annually in coastal provinces), labor shortages (younger workers avoiding factory jobs), quality consistency demands from export buyers, and government subsidies for automation equipment purchases (15-30% of capital expenditure).
2. Factories with Robotic Automation – 40% More Capacity-Efficient
The most striking finding from our factory capacity analysis is that factories with robotic automation are 40% more capacity-efficient than non-automated competitors. This efficiency gap has widened from 25% in 2020 to 40% in 2026, as automation technology has improved while labor-intensive processes have faced diminishing returns.
Detailed breakdown of the 40% efficiency advantage:
- Output per worker (automated vs. non-automated): Automated factories produce 2.8x more output per worker. A non-automated factory with 200 workers producing $10M annually ($50K per worker) vs. automated factory with 100 workers producing $14M ($140K per worker) – 180% higher per-worker productivity.
- Capacity utilization rate: Automated factories average 88% utilization vs. 65% for non-automated – 35% higher. Automation enables 24/7 operation with reduced shift dependency.
- Defect rate (quality consistency): Automated lines average 0.8% defect rate vs. 3.5% for manual lines – 77% fewer defects. Less rework means more effective capacity.
- Changeover time (between product runs): Automated lines: 45 minutes average. Manual lines: 3 hours average – 75% faster changeovers enable smaller batch sizes and more product variety.
- Overtime and shift productivity: Automated lines maintain 95% efficiency on night shifts. Manual night shifts drop to 70% efficiency due to fatigue.
- Energy efficiency per unit: Automated processes (servo motors, optimized sequences) use 18-25% less energy per unit produced compared to manual-equivalent processes.
The 40% capacity efficiency advantage translates directly to cost competitiveness. Automated factories can produce the same volume as non-automated competitors with 30-40% lower labor costs, higher quality, and faster delivery times.
3. Which Factories Lag Behind Competitors? The Automation Divide
As automation investment surges, some factories lag behind competitors due to capital constraints, management mindset, or location disadvantages. Understanding which factories are lagging helps buyers identify supply chain risks.
Segments where factories lag behind competitors:
- Small and medium enterprises (SMEs) with under 100 workers: Only 22% have meaningful automation vs. 78% of large factories. Key barriers: upfront capital (robotic cells cost $50,000-200,000 each), lack of in-house engineering talent, and smaller batch sizes that complicate automation ROI.
- Inland provinces (Sichuan, Hunan, Hubei, Henan, Shaanxi, etc.): Robot density 150-250 vs. coastal 500+. Lag due to lower labor cost pressure (inland wages 30-40% below coastal), fewer automation integrators, and less government subsidy awareness.
- Traditional industries (furniture, footwear, garment, toys): Automation adoption below 15% in many sub-sectors due to product variability, soft materials handling challenges, and historically low margins. However, leaders in these sectors are automating rapidly – widening the gap further.
- Second-tier suppliers (subcontractors to large manufacturers): Large OEMs have automated heavily, but many of their tier-2 and tier-3 suppliers lack automation. This creates capacity mismatches and quality inconsistencies.
- Family-owned factories without professional management: Owner-operators aged 55+ often view automation as risky or unnecessary. Their professionally managed competitors are pulling ahead.
The automation divide is self-reinforcing. Automated factories gain market share through lower costs and better quality, increasing their profits and enabling further automation investment. Non-automated factories lose market share, reducing profits and making automation investment unaffordable – creating a death spiral.
4. Comparison – Automated vs. Non-Automated Factory Performance Metrics
The gap between automated and non-automated factories extends beyond capacity efficiency to nearly every operational metric:
- Labor cost per unit: Automated: $0.50-1.50 depending on industry. Non-automated: $2.00-5.00. Advantage: automated (60-75% lower).
- Production lead time (order to shipment): Automated: 15-25 days. Non-automated: 30-45 days. Advantage: automated (40-50% faster).
- Minimum order quantity (MOQ) flexibility: Automated: 500-1,000 units (fast changeovers). Non-automated: 3,000-5,000 units (long changeover times). Advantage: automated (smaller batches, less inventory risk for buyers).
- Quality consistency (defect PPM): Automated: 500-2,000 PPM. Non-automated: 5,000-15,000 PPM. Advantage: automated (70-90% fewer defects).
- Peak production capacity (surge capability): Automated: 30-40% surge possible (add shifts). Non-automated: 10-20% surge (limited by labor availability). Advantage: automated.
- Traceability (batch/lot tracking): Automated: full digital traceability. Non-automated: paper-based or none. Advantage: automated (critical for regulated industries like medical devices, automotive, food).
- Energy cost per unit: Automated: 18-25% lower due to servo motors and optimized sequences. Advantage: automated.
- Workplace safety incident rate: Automated: 60-80% lower (robots handle dangerous tasks). Advantage: automated.
For buyers, these differences mean that selecting an automated factory reduces landed cost, improves quality, shortens lead times, and lowers supply chain risk. Selecting a non-automated factory requires accepting higher costs, longer lead times, and greater quality variability.
5. Why Some Factories Lag Behind Competitors – Root Causes
Understanding why some factories lag behind competitors despite the clear efficiency advantages of automation helps buyers assess supplier risk and helps lagging factories identify improvement paths.
Root causes of automation lag:
- Capital constraints (most common cause): A basic robotic cell costs $50,000-200,000. A fully automated production line can cost $500,000-2,000,000. Small factories with thin margins (3-8%) cannot self-fund automation. Bank loans require collateral many factories lack.
- Lack of technical expertise: Automation requires engineers who understand robotics, programmable logic controllers (PLCs), vision systems, and integration. Small and medium factories cannot attract or retain such talent.
- Product variability challenges: Factories producing highly customized, low-volume, or irregular products (e.g., furniture, garment samples) find traditional automation difficult. However, collaborative robots (cobots) and vision-guided systems are reducing this barrier.
- Management mindset (generational): Factory owners aged 55+ who built their businesses on cheap labor often view automation as unnecessary or threatening. Their children (next-generation owners) are typically more automation-embracing.
- Location disadvantage: Factories in inland provinces have less access to automation integrators, spare parts, and technical support. Shipping robots to Sichuan costs more and takes longer than to Guangdong.
- Government subsidy complexity: While automation subsidies exist (15-30% of equipment cost), application processes are complex. Many small factories lack administrative capacity to apply.
- Customer pressure absence: Factories serving undemanding customers (low-price, low-quality segments) face no pressure to automate. However, as their customers lose market share, these factories eventually face existential pressure.
The automation gap is widening because automated factories gain cost and quality advantages that increase their market share and profits, enabling further automation investment. Non-automated factories face a death spiral of declining competitiveness.
6. How Our Capacity Checks Now Include Automation Level Assessment
Given that factories with robotic automation are 40% more capacity-efficient, automation level assessment has become essential for accurate capacity verification. Our capacity checks now include automation level assessment as a standard component for all factory audits.
Our automation level assessment framework includes:
- Robot density measurement: Count of industrial robots (welding, assembly, pick-and-place, packaging, palletizing) relative to production line length or worker count. Benchmarking against industry averages for the factory's sector.
- Automation type classification: Fixed automation (dedicated equipment for high-volume production), programmable automation (batch production with changeover capability), flexible automation (robotic cells adaptable to multiple products), or collaborative robots (cobots working alongside humans).
- Key automation metrics captured: Number of robotic arms by type (articulated, SCARA, delta, collaborative), automation coverage percentage (percentage of production steps automated), changeover time (minutes between product runs), and automation vendor (domestic vs. international – quality indicator).
- Digital integration assessment: Whether robots are connected to manufacturing execution systems (MES) or supervisory control and data acquisition (SCADA) systems for real-time monitoring, predictive maintenance, and production tracking.
- Automation ROI and payback period calculation: Based on factory's labor cost savings, quality improvement, and capacity increase – indicates management sophistication and future automation investment likelihood.
- Automation maturity rating (1-5 scale): Level 1 (manual, no automation), Level 2 (isolated automated stations), Level 3 (integrated automated lines), Level 4 (fully automated with digital monitoring), Level 5 (Industry 4.0 with AI optimization).
Our capacity check reports now include an automation level dashboard showing robot density, automation coverage percentage, changeover time, digital integration status, and maturity rating – alongside traditional capacity metrics like maximum output, utilization rate, and lead times.
7. Practical Roadmap for Buyers – Evaluating Factory Automation Levels
For buyers seeking to avoid factories that lag behind competitors, follow this five-step roadmap to evaluate automation levels during supplier selection and capacity checks:
- Request automation metrics in RFQ (Immediate). Include automation-specific questions in request for quotation: robot count by type, automation coverage percentage, changeover time, and defect rate. Compare responses against industry benchmarks.
- Conduct video tour focused on automation (During initial assessment). Request video walkthrough specifically highlighting automated work cells, robotic arms, conveyor systems, and control panels. Manual-intensive areas are red flags for capacity efficiency.
- Require automation level assessment in factory audit (Before order placement). Our capacity checks now include automation level assessment. If using other auditors, ensure automation metrics are included. Do not accept audits that only count machines without assessing automation integration.
- Calculate effective capacity using automation-adjusted metrics (During supplier selection). Automated factories can sustain higher utilization (85-90% vs 60-70% for manual). Use automation-adjusted effective capacity for production planning – not just theoretical maximum output.
- Factor automation level into risk scoring (Ongoing). Assign higher risk scores to factories with low automation maturity (Level 1-2). These suppliers face greater risk of cost inflation (as labor wages rise), quality inconsistency, and capacity constraints during peak seasons.
Buyers who ignore automation levels risk partnering with factories that lag behind competitors – accepting higher costs, lower quality, and greater supply chain risk.
8. Practical Roadmap for Factories – Closing the Automation Gap
For factories that currently lag behind competitors, closing the automation gap is essential for survival. Follow this six-step roadmap:
- Conduct automation opportunity audit (Month 1). Map production processes. Identify repetitive, high-volume, ergonomically difficult, or quality-critical tasks. Calculate potential ROI for automating each task (labor savings + quality improvement + capacity increase).
- Prioritize high-ROI, low-complexity automation (Month 2-3). Start with palletizing, packaging, machine tending, or material handling – these have fastest payback (12-18 months). Avoid complex assembly automation initially.
- Explore government subsidies (Month 1-2). Local economic development bureaus offer 15-30% equipment subsidies for automation. Hire consultant to navigate application process. Many factories leave subsidy money on the table.
- Consider collaborative robots (cobots) for SMEs (Month 3-6). Cobots cost $25,000-50,000 (vs. $50,000-200,000 for traditional industrial robots). Easier programming, no safety cages, work alongside humans. Ideal for small-batch, high-mix production.
- Build or borrow technical expertise (Month 3-6). Hire automation engineer (salary 200-300k RMB/year). Or partner with automation integrator on revenue-share basis (integrator provides robots for percentage of savings).
- Train workforce on robot operation and maintenance (Month 6-9). Automation fails without skilled operators and maintenance staff. Invest in training programs – many robot vendors (ABB, Fanuc, KUKA, Estun) offer certified training.
9. Frequently Asked Questions – Factory Automation and Capacity
Q: What is the minimum order volume to justify automation investment?
A: Traditional industrial robots: 50,000+ units annually typically justifies investment. Collaborative robots (cobots): 10,000-20,000 units annually. For very high-mix, low-volume production (under 5,000 units per SKU), focus on changeover time reduction rather than full automation.
Q: Do automated factories always have better quality than manual factories?
A: Yes, for repetitive tasks with consistent inputs. Automated processes eliminate human error, fatigue, and inconsistency. However, automated factories require robust maintenance programs – poorly maintained automation has worse quality than well-managed manual processes. Always verify maintenance records during audit.
Q: Can a factory be too small for automation?
A: Previously yes, but collaborative robots and robotic cells have lowered the minimum scale. A factory with 20-50 workers can justify 1-3 cobots for material handling, packing, or machine tending. Payback periods of 12-18 months are achievable. Factories that claim "too small for automation" often lack awareness of cobot options.
Q: How does automation affect a factory's ability to handle rush orders?
A: Automated factories are significantly better at handling rush orders. They can add shifts without labor constraints (robots work 24/7). Changeover times are faster (45 minutes vs 3 hours). Automated factories typically have 30-40% surge capacity vs. 10-20% for manual factories.
Q: What automation level should I require from my suppliers?
A: Depends on your industry and volume. For high-volume consumer electronics, automotive, or medical devices: Level 3 (integrated automated lines) or Level 4 (fully automated with digital monitoring). For low-volume, high-mix products: Level 2 (isolated automated stations) or cobot-assisted Level 3 may suffice. Below Level 2 is high risk.
Q: Are domestic Chinese robot brands as good as international brands?
A: For basic applications (palletizing, material handling, welding), domestic brands (Estun, Inovance, Siasun, EFORT) are now 85-95% as reliable as international brands (ABB, Fanuc, KUKA, Yaskawa) at 40-60% lower cost. For precision applications (assembly, small parts handling), international brands still lead. Our automation assessments capture vendor type.
Summary: Automation investment in Chinese manufacturing has surged to record levels with 352,000 industrial robots installed in 2025 (+22% YoY), but some factories lag behind competitors – creating a widening productivity gap where factories with robotic automation are 40% more capacity-efficient than non-automated factories. China now accounts for 52% of global robot installations, with robot density reaching 470 per 10,000 manufacturing workers (up from 320 in 2021). The 40% efficiency advantage of automated factories manifests across multiple metrics: output per worker is 2.8x higher, capacity utilization 88% vs 65% (+35%), defect rates 0.8% vs 3.5% (-77%), changeover time 45 minutes vs 3 hours (-75%), and night shift efficiency 95% vs 70%. However, significant automation divides persist: small factories under 100 workers have only 22% automation vs 78% for large factories; inland provinces have robot density 150-250 vs 500+ in coastal regions; traditional industries (furniture, footwear, garment) remain under 15% automated; and tier-2 suppliers and family-owned factories without professional management lag severely. Root causes of automation lag include capital constraints ($50k-200k per robotic cell), lack of technical expertise, product variability challenges, management mindset (older owners), location disadvantage, and subsidy complexity. Our capacity checks now include automation level assessment with robot density measurement, automation type classification (fixed/programmable/flexible/cobot), coverage percentage, changeover time, digital integration status (MES/SCADA), ROI payback period calculation, and automation maturity rating (1-5 scale from manual to Industry 4.0). For buyers, the roadmap includes requesting automation metrics in RFQ, conducting video tours focused on automation, requiring automation level assessment in audits, calculating effective capacity using automation-adjusted metrics (automated factories sustain 85-90% utilization vs 60-70% for manual), and factoring automation level into risk scoring. For lagging factories, closing the gap requires automation opportunity audits (prioritizing palletizing/packaging with 12-18 month payback), applying for government subsidies (15-30% of equipment cost), considering collaborative robots ($25k-50k for SMEs), building technical expertise, and training workforce. As automation investment surges, buyers who ignore automation levels risk partnering with factories that lag behind competitors – accepting higher costs, lower quality, longer lead times, and greater supply chain risk.